Observing Cloud Native Applications With IBM Instana
Instana provides a real-time, automated Enterprise Observability Platform that helps Site Reliability Engineers improve the reliability and resiliency of cloud-native applications. For initial context, read my previous blog Introducing IBM Instana Observability.
Installing Robot-shop on OpenShift
Robot-shop is a sample microservices application, including a load generation tool which can be used to showcase some Instana features.
To deploy Robot-shop on OpenShift, there are some specific steps to assign additional permissions to the default service account:
1
2
3
4
5
export KUBECONFIG=/path/to/oc/cluster/dir/auth/kubeconfig
oc adm new-project robot-shop
oc adm policy add-scc-to-user anyuid -z default -n robot-shop
oc adm policy add-scc-to-user privileged -z default -n robot-shop
cd robot-shop/K8s
Then the sample can be installed with Helm:
1
2
kubectl create ns robot-shop
helm install robot-shop --set openshift=true -n robot-shop helm
After successful deployment, the following pods will be running:
1
2
3
4
5
6
7
8
9
10
11
12
13
14
oc get pods
NAME                        READY   STATUS    RESTARTS       AGE
cart-7d7745696b-st4zv       1/1     Running   0              22h
catalogue-998b69bc9-l2g5q   1/1     Running   0              22h
dispatch-69b65d89b9-6l2bw   1/1     Running   0              22h
mongodb-67c5456f4-hbw49     1/1     Running   0              17h
mysql-6d778f4c8f-nskkd      1/1     Running   0              17h
payment-5465d9cc79-r4tfw    1/1     Running   0              17h
rabbitmq-785b678f74-25rnn   1/1     Running   0              22h
ratings-7ccf67b49f-j7rt2    1/1     Running   0              17h
redis-0                     1/1     Running   0              22h
shipping-7f6dfbf46f-5nr5x   1/1     Running   29 (17h ago)   22h
user-899b6c7ff-d9jl9        1/1     Running   0              22h
web-5bc8df6567-lfg4l        1/1     Running   0              17h
The web front end can be accessed via the Service. As it is a ClusterIp service, a port forward from your local workstation is required:
1
oc port-forward service/web 8080:8080
The web application is available on http://localhost:8080.
Robot-shop Load Generation
Before exploring Instana, it’s useful to put the application under some load. The robot-shop repository contains a python script which uses Locust to generate application requests. This script can either run on the local workstation, or can be run in a container on k8s.
I used the provided Deployment to deploy to OpenShift, adjusting the following environment variable to use the Service name for the robot-shop web app:
1
2
 - name: HOST
   value: "http://web.robot-shop.svc.cluster.local:8080/"
Create an Instanan Application Perspective
An Application Perspective groups together different services and endpoints which share a context, i.e.they are all associated with the same application. Application Perspectives can also be role specific, allowing Developers or DevOps to organise and visualise the exact information they need.
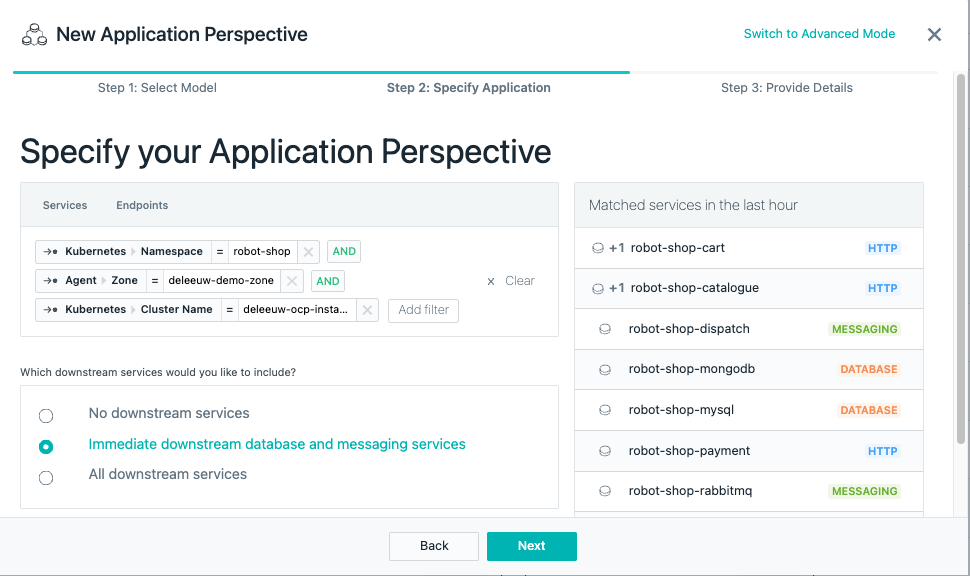
I created an application perspective for the Robot-shop namespace, running in the deleeuw-demo-zone. I also added a query to define a specific cluster within the zone.
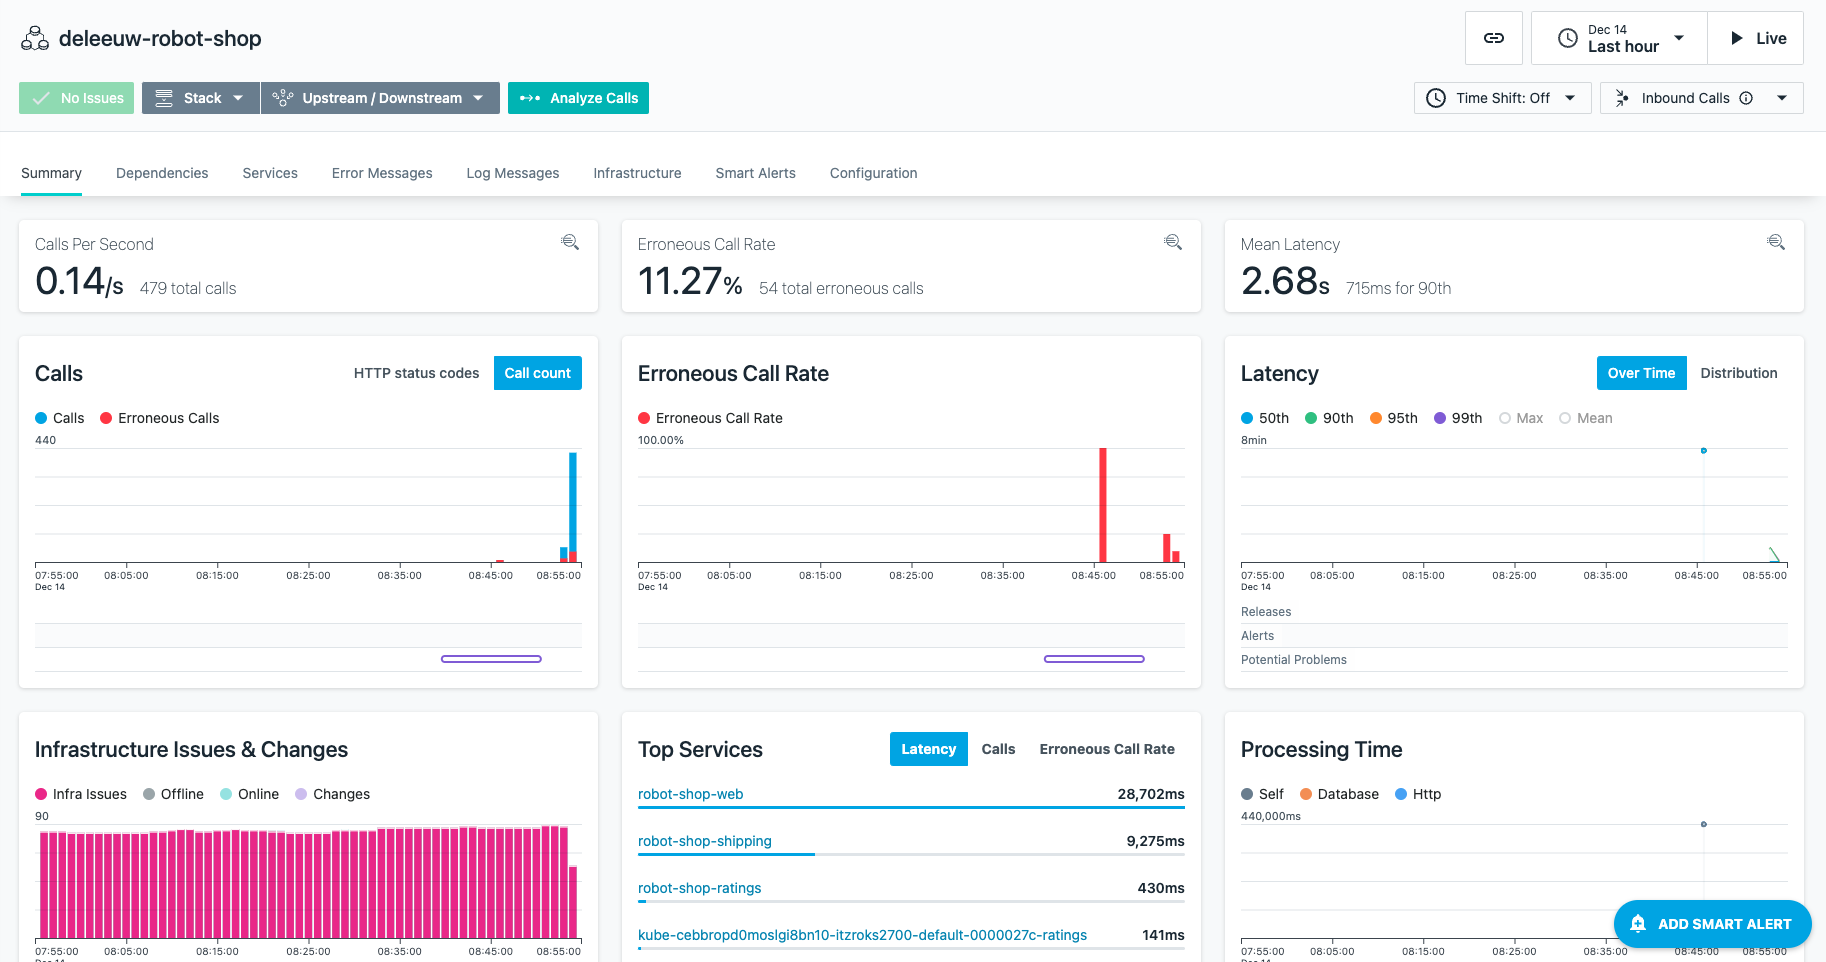
This is the resulting dashboard for the application perspective.
It includes key metrics that would be useful to an SRE tasked with overseeing the robot-shop application. All metrics can be reviewed over a specific period of time, or live with per second granularity. In addition, Instana builds a context of upstream and downstream services, and related physical infrastructure. A good example of this is the dependency diagram which shows traffic flows between the services of the application, and highlights any issues.
Monitoring Application Calls
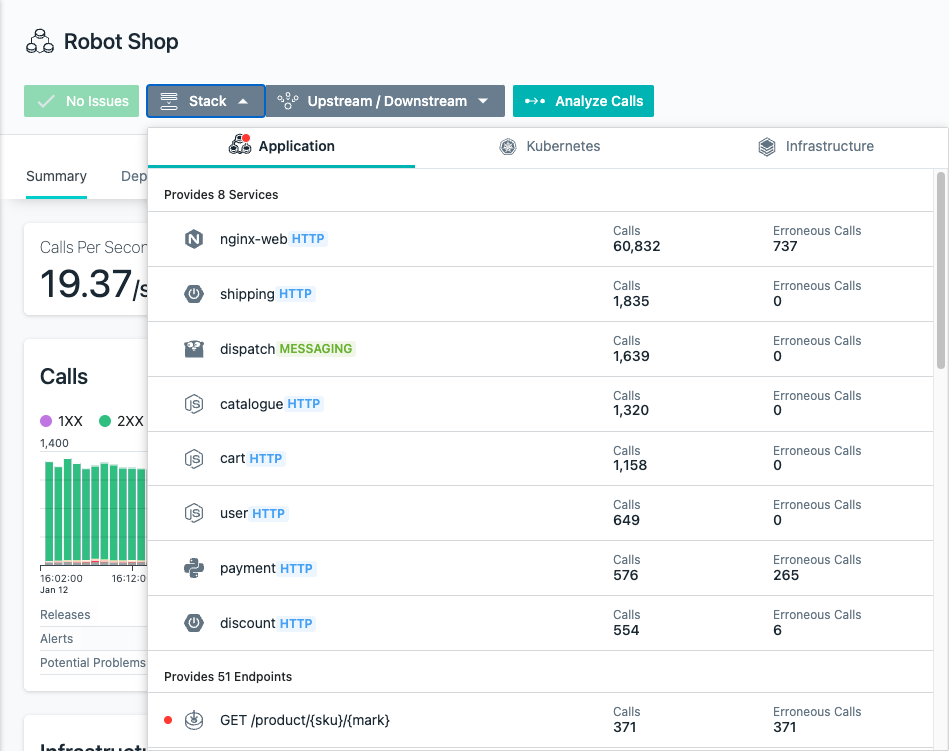
The Stack->Applications view provides details of the top services for the application:
For example, you can drill into the user service, which happens to be a Node.js application:
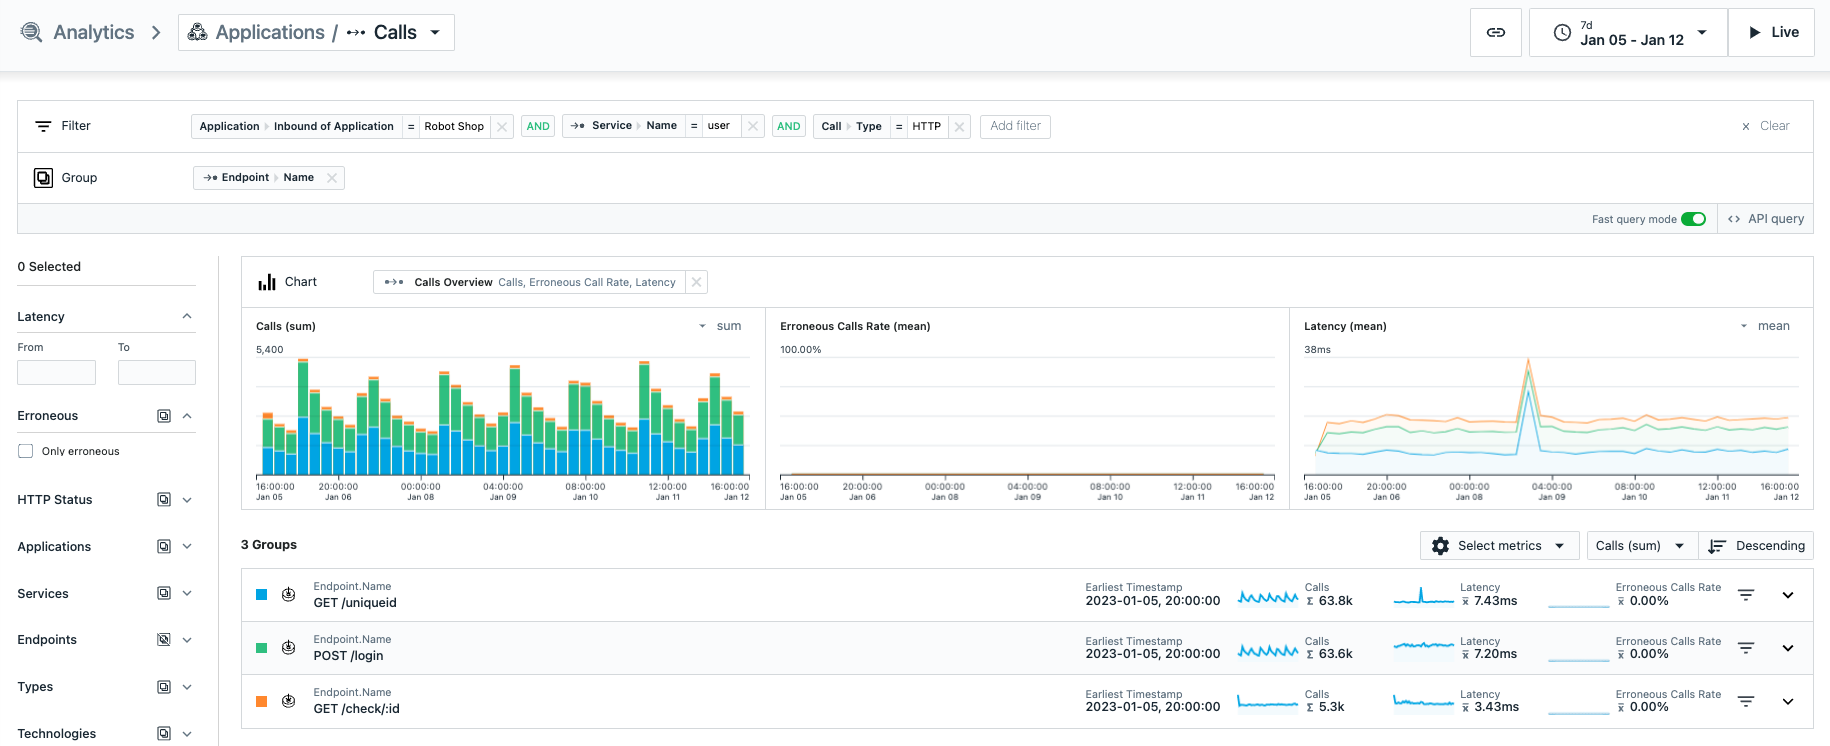
This presents a dashboard including all the endpoints for the service:
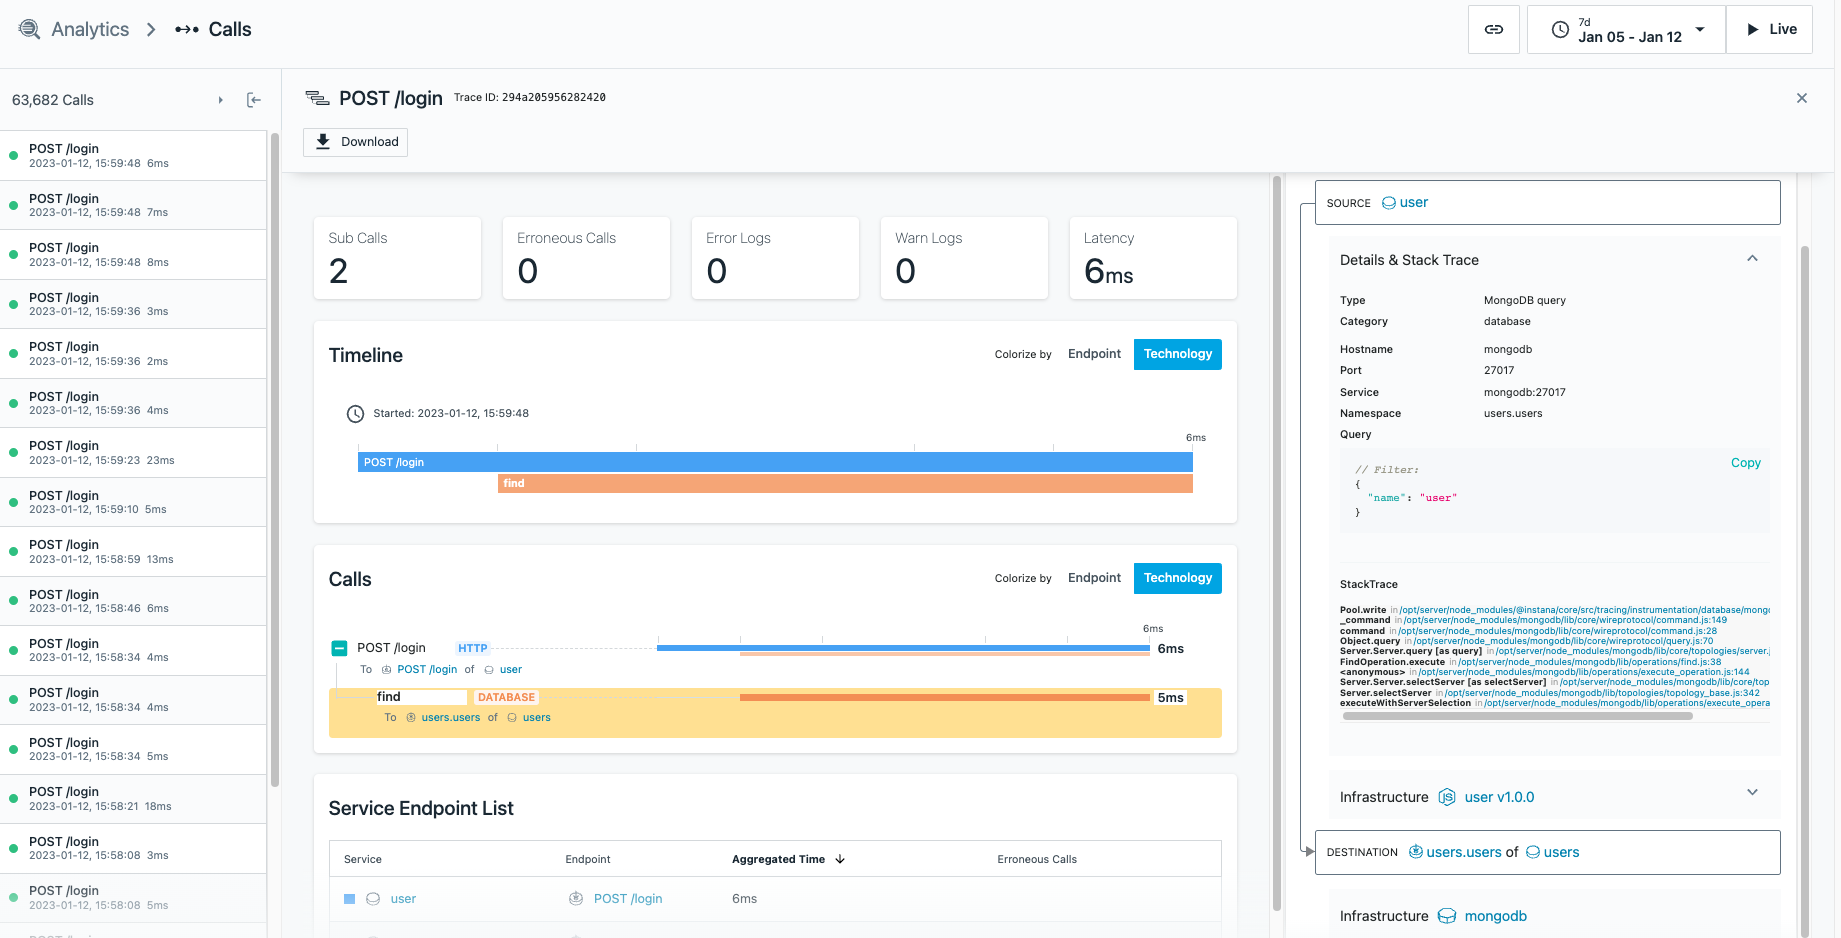
An endpoint can be expanded (in this case `/login’) to show individual service calls, including their latency.
For each request, you can view a detailed breakdown of the steps the /login endpoint expected. In this case, the entire duration of /login was 6ms, and included a 5ms service call to users.users endpoint of the users Mongodb service. You can also see a detailed stack trace of each step, which would be invaluable if for example some requests were taking longer or returning errors.
Code Profiling & Java JVM Statistics
Code profiling helps detect problem areas and bottlenecks at the code level. Instana includes an AutoProfile feature where the agent checks the available profiles in supported runtimes and reports them to the Instana backend. Some runtimes automatically provide profiling data (e.g. many Java JVMs), but for other runtimes (e.g. Node.js) you may need to update the application to import an additional profiling library.
In addition, the Instana agent must be configured to collect the profiling data. In the configuration.yaml used to install the agent, there is a ConfigMap manifest which configures the agent DaemonSet.
I added the following section to the ConfigMap to enable profile collection for Java:
1
2
com.instana.plugin.profiling.java:
  enabled: true
I also set the following ENV variable on the DaemonSet (this could alternatively have been included in the ConfigMap) which enables profile collection for other runtimes:
1
2
- name: INSTANA_AUTO_PROFILE
  value: "true"
I updated the resources on the cluster:
1
oc apply -f configuration.yaml
After taking these steps, I restarted the Robot-shop pods.
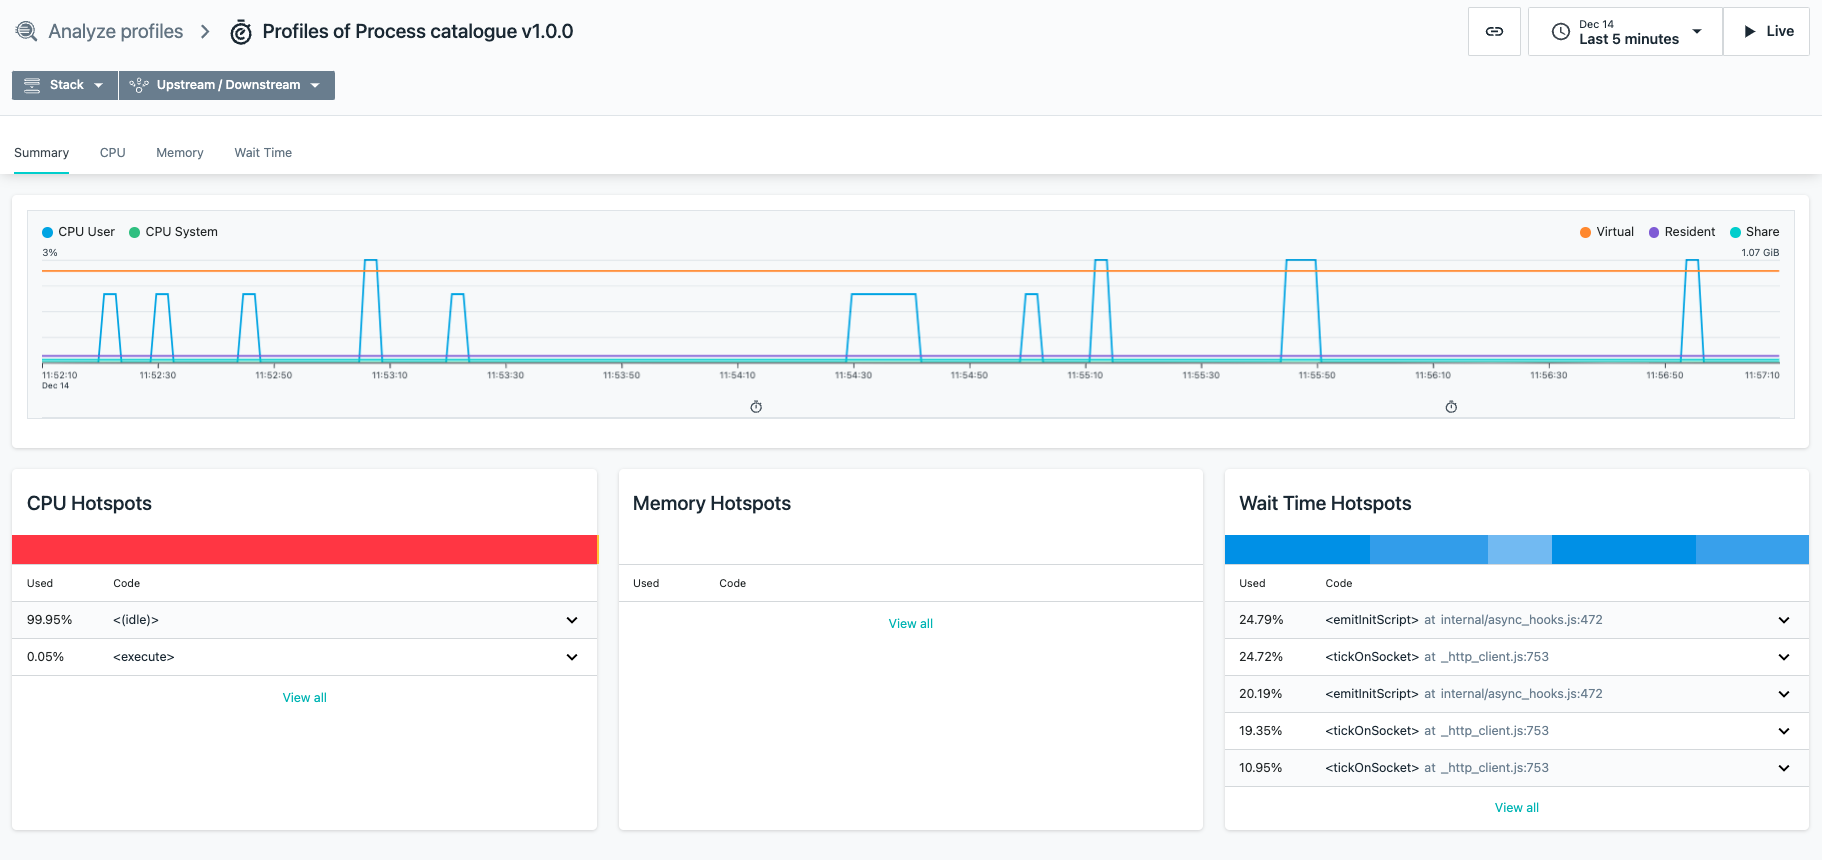
In the Analytics->Profile menu, you can filter for profiles available. Here you can see profile information for the services running in zone deleeuw-demo-zone:
Viewing the profile information shows performance data for the process that was profiled, in this case the Catalog service:
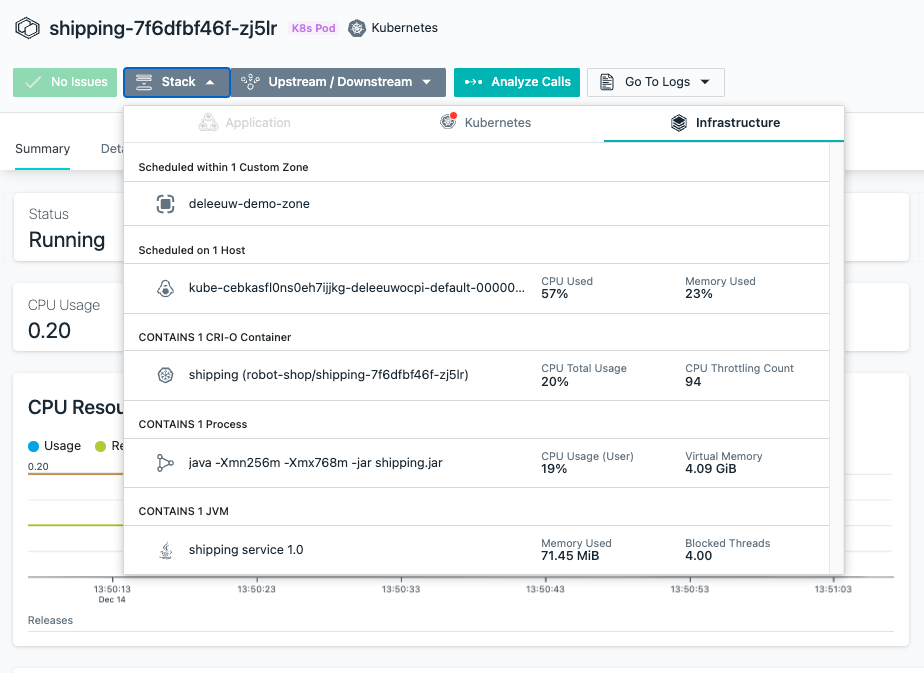
For services that use Java, you can also view the JVM statistics. For example, the Shipping microservice in the Robot-shop application is a Java SpringBoot application. Here is the Shipping pod in the cluster:
Select the pod, followed by Stack->Infrastructure to see the associated JVM.
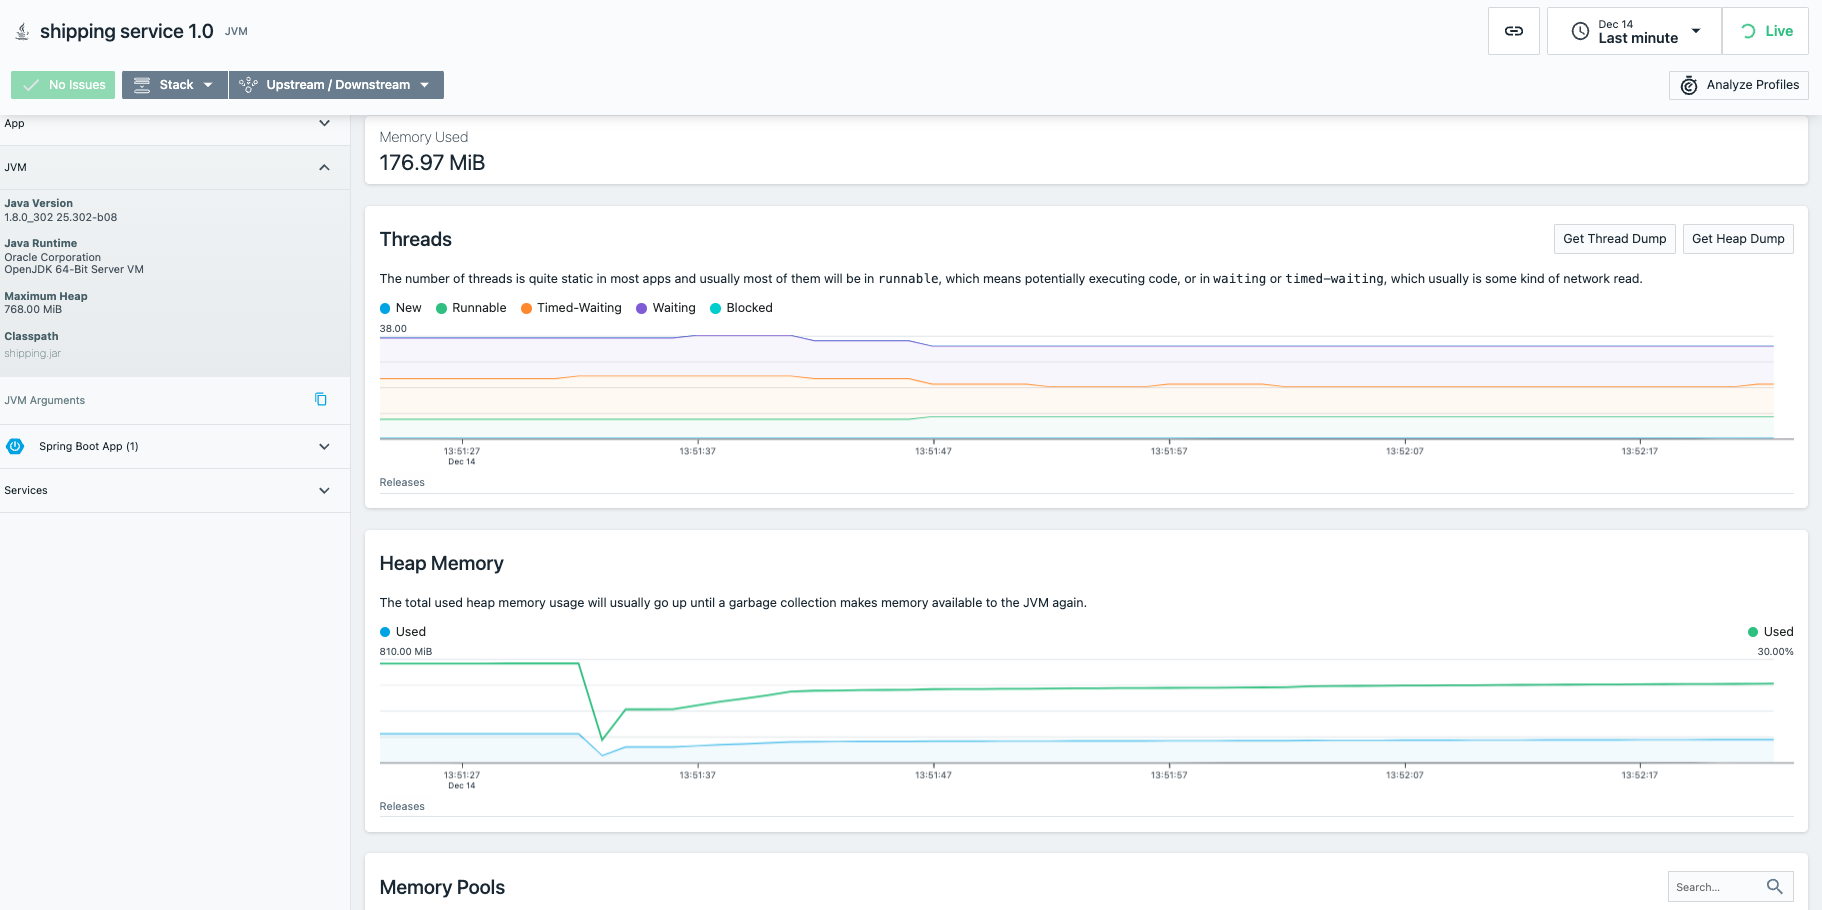
Instana reports JVM statistics includes heap memory, GC, memory pools etc:
Creating Application Alerts
Instana can alert you to several types of events, using multiple channels including email, Slack, Teams, webhooks etc. The first step is to set up an Alert Channel in Settings->Add Alert Channel.
Alerts can be configured with Alerts->New Alert. Alerts can be triggered on:
- Event Types - e.g. Incidents, Critical, Warnings, Changes etc. These built-in events are predefined based on integrated algorithms.
- Individual Events - Many are built in and apply to specific entities, e.g. ‘Tomcat has reached a maximum number of connections’. Custom events can also be created.
- Smart Events - These relate to the end user experience of a website, including website slowness, JavaScript errors, HTTP errors etc. Instana can automatically generate these events for the web application, including setting appropriate thresholds.
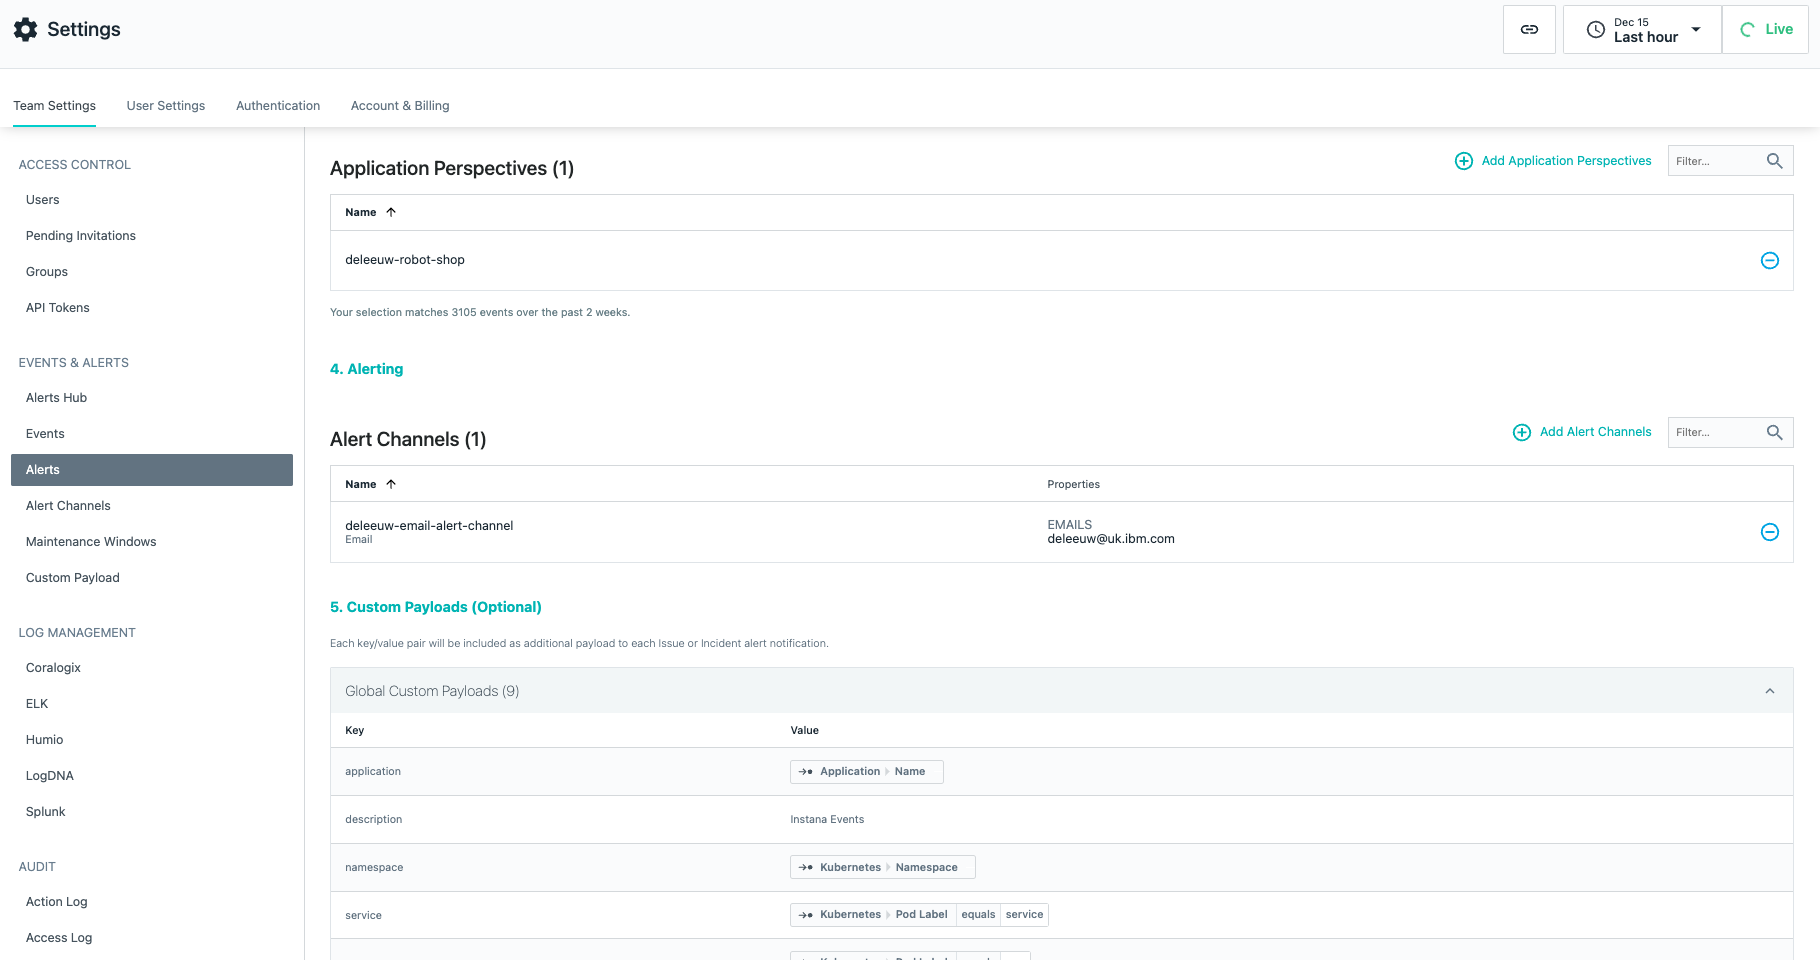
By default, an alert message will include some “global payload”, e.g. relevant data like application, namespace, IP addresses etc. It is also possible to augment or override these values with additional payload fields on an per alert basis.
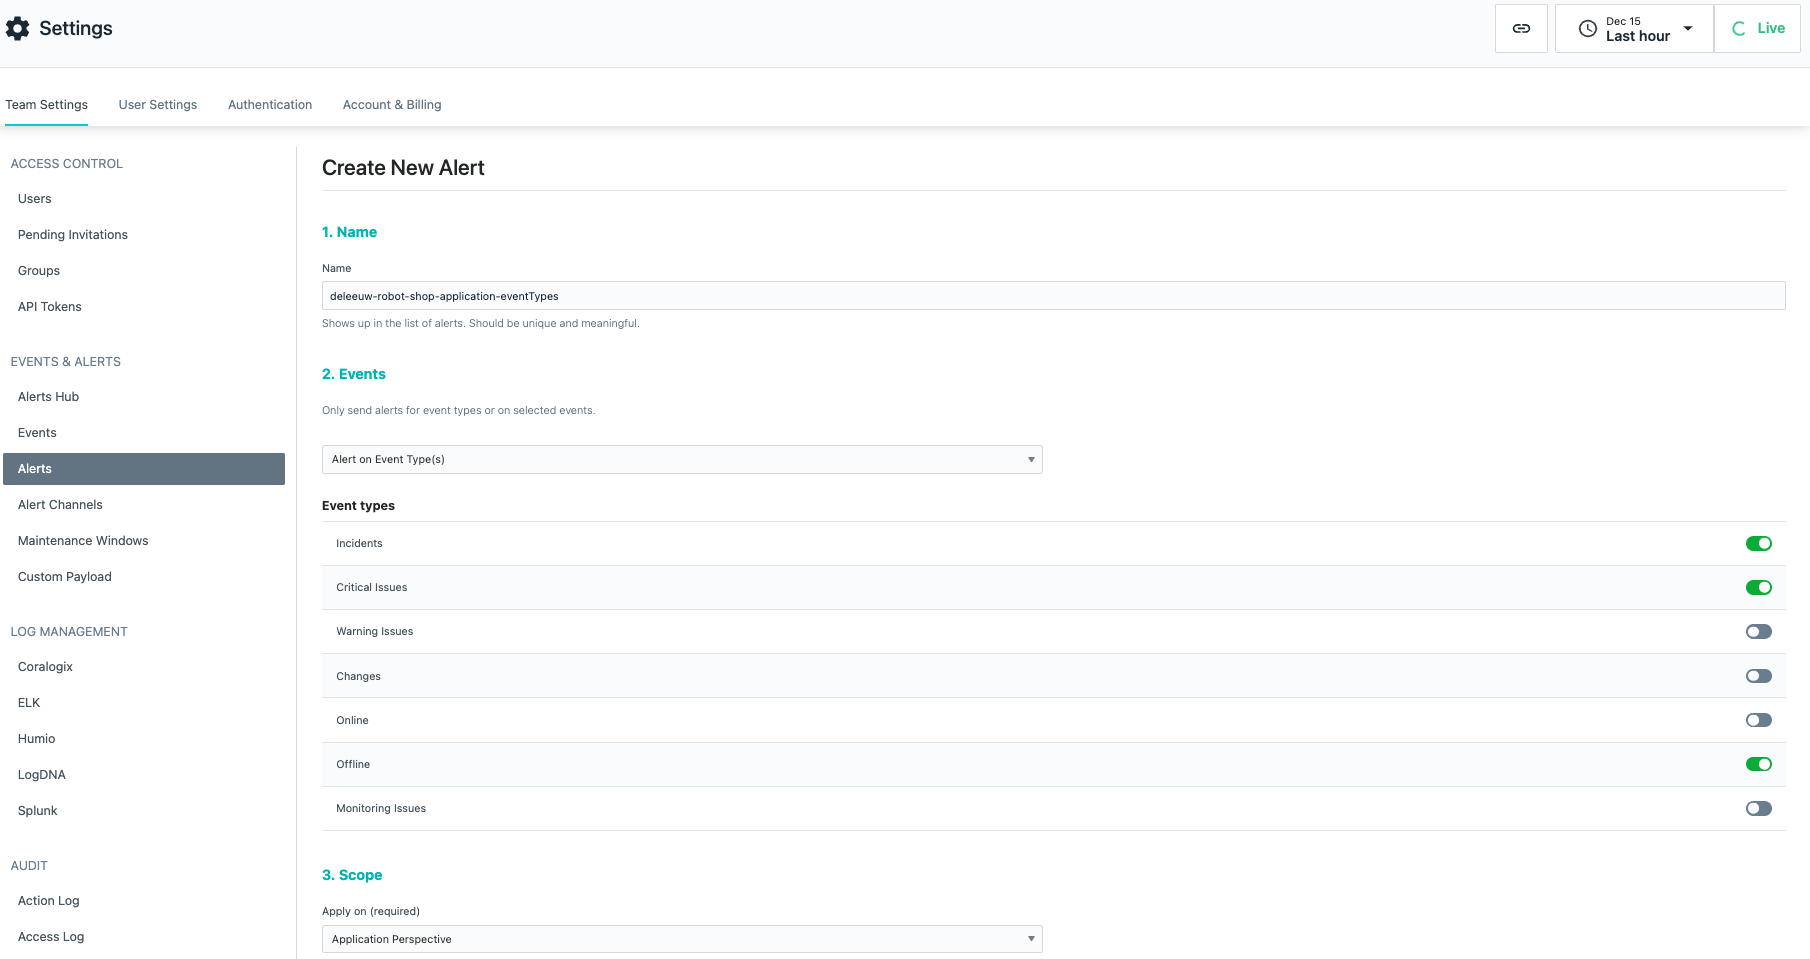
I created an alert for event types (Incidents, Critical issues & offline). It was scoped to the deleeuw-robot-shop application perspective and I used an alert channel which sends an email to me.
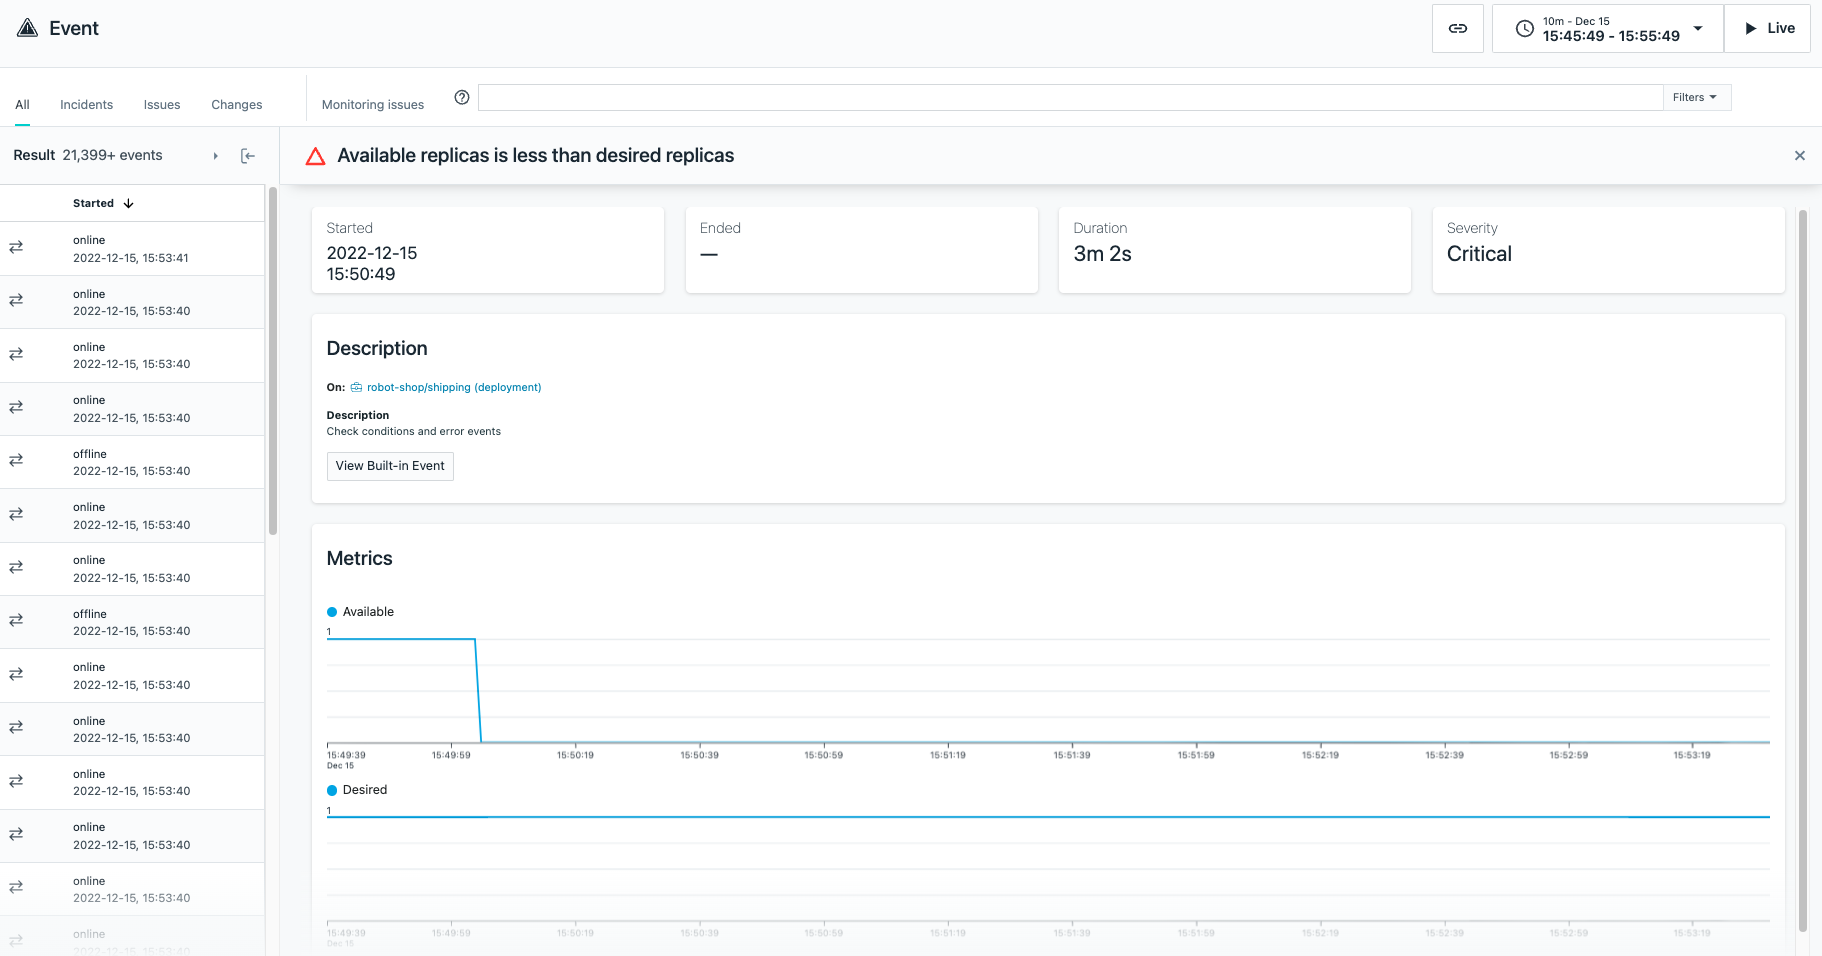
I tested the alert by deleting the pod running the Shipping service. This triggered several email alerts, including an Issue that the replica count had depleted, and an Offline when the Shipping service and its associated infrastructure were not running.
The alert emails contained links which direct to the Events tab on Instana, for example the Issue alert showed the depleted replica count:
Fortunately, the k8s Deployment quickly replaced the pod and Instana sent emails to cancel the alerts!
In subsequent blogs I will demonstrate some of the IBM specific technologies which Instana can discover and observe.
